Tag: Java-Tech-Popularity-Index
32 articles with this tag
Java Tech Popularity Index Q1/2024: Web Frameworks
Summary for Q1/2024
Here is the scorecard of React (left) and Vue (right) vs. Angular (100%), not on the card. The arrows show the trend vs. Angular.
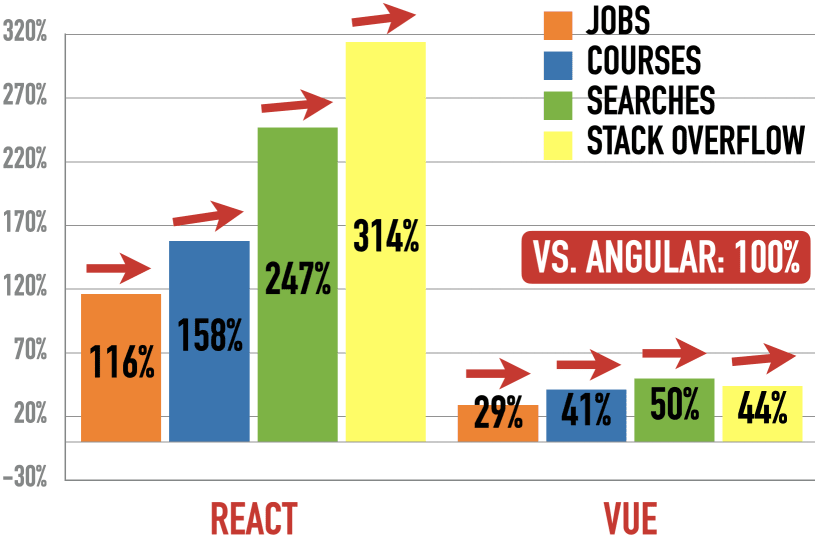
React pulls away from Angular except for jobs where React holds steady. Vue holds steady everywhere except for slight gains at Stack Overflow.
Java Tech Popularity Index Q1/2024: JVM Languages
Summary for Q1/2024
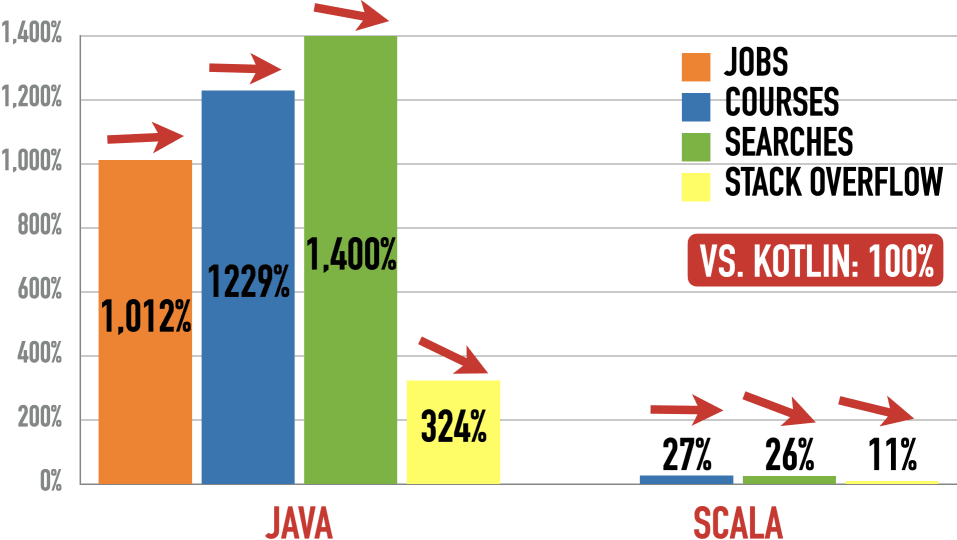
Here is the scorecard of Java (left) and Scala (right) vs. Kotlin (100%), not on the card. The arrows show the trend vs. Kotlin.

Please take the Kotlin numbers with a huge grain of salt: Most Kotlin development is on Android, not in JVM projects. Java loses to Kotlin in all categories except for jobs. Scala declines against Kotlin in searches and Stack Overflow but holds steady in Udemy Courses. Please see the job ad section for why job numbers for Scala are missing.
Java Tech Popularity Index Q1/2024: IDEs
Summary for Q1/2024
Here is the scorecard of VS Code (left) and Eclipse (right) vs. IntelliJ (100%), not on the card. The arrows show the trend vs. IntelliJ.
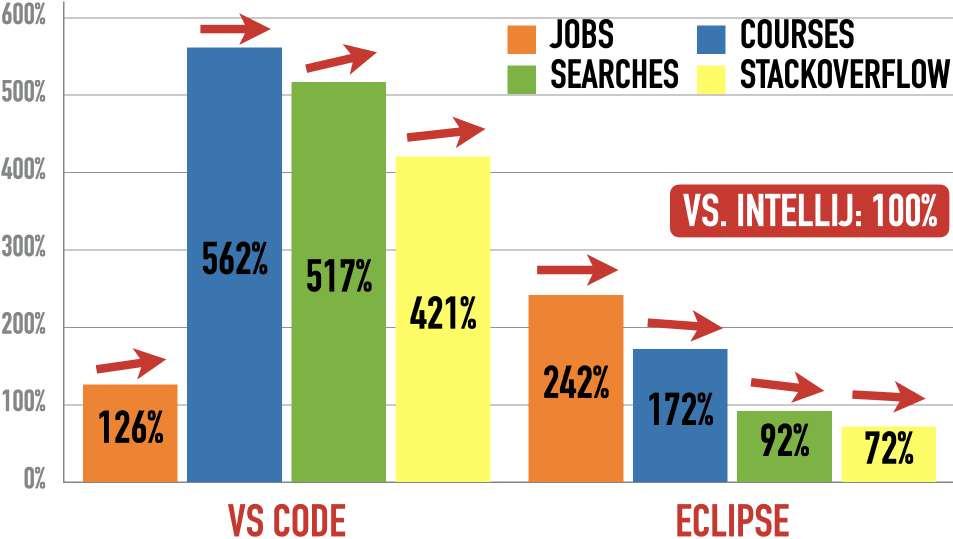
VS Code pulls away from IntelliJ in all categories except Udemy courses. Eclipse loses ground to IntelliJ in all categories.
Java Tech Popularity Index Q1/2024: Front-End Mobile
Summary for Q1/2024
Here is the scorecard of React Native (left) and Xamarin (right) vs. Flutter (100%), not on the card. The arrows show the trend vs. Flutter.
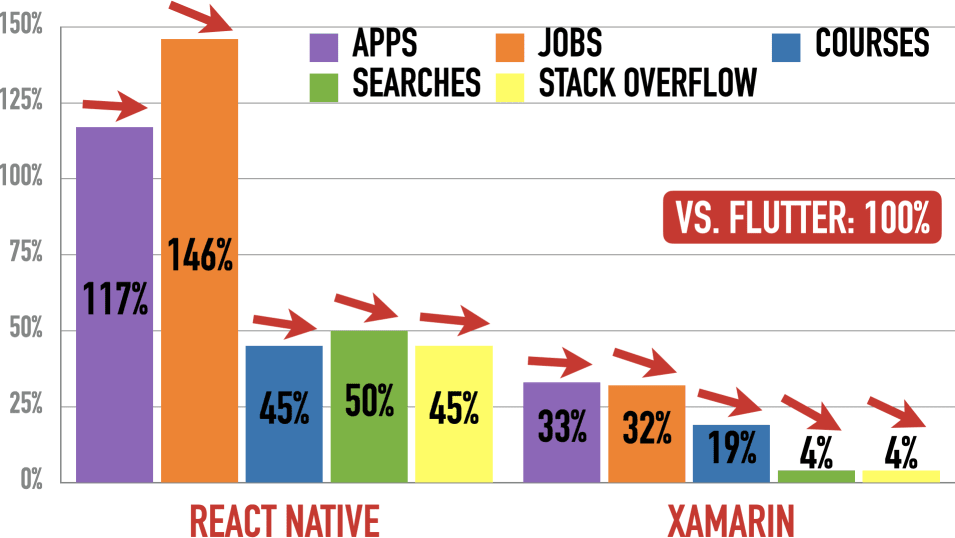
React Native and Xamarin lose to Flutter in all categories.
Here are my recommendations:
- Don’t build two separate applications with Apple’s and Google’s first-party frameworks. Use a cross-platform framework instead.
- If you already use Flutter or React Native in your project, keep using them. Otherwise, evaluate a migration. In many (most?) cases, such migration doesn’t make business sense.
- If you start a new project or migrate and have used React before, start with React Native first and use Flutter otherwise.
- If you start a new project or migrate and have not used React, begin with Flutter first and use React Native otherwise.
Archive
| 2023 | Q4 | Q3 | Q2 | Q1 | ||||
| 2022 | Q4 | Q3 | Jun | May | Apr | Mar | Feb | Jan |
| 2021 | Dec | Nov |
Table Of Contents
Applications
These recommendations are for building native enterprise applications on iOS and Android - forms, data grids, and reports. They are not for games or media applications.
Java Tech Popularity Index Q1/2024: Databases
Summary for Q1/2024
Here is the scorecard of MySql (left) and MongoDB (right) vs. Postgres (100%), not on the card. The arrows show the trend vs. Postgres.
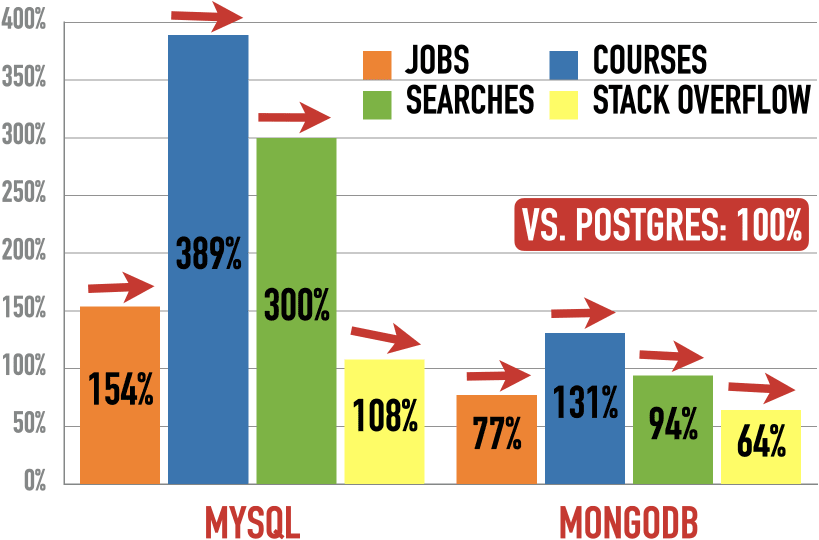
MySQL and MongoDB gain jobs on Postgres. MySQL loses slightly in courses, holds steady in searches, and drops more heavily in Stack Overflow questions. MongoDB holds steady in courses but loses slightly in searches and Stack Overflow questions.
Java Tech Popularity Index Q1/2024: Build Tools
Summary for Q1/2024
Here is the scorecard of Maven (left) and Ant (right) vs. Gradle (100%), not on the card. The arrows show the trend vs. Gradle.

Maven loses to Gradle except for jobs, where it rises slightly. Ant has disappeared from searches and Stack Overflow but surprisingly gains in jobs.
Java Tech Popularity Index Q1/2024: Back-End Frameworks
Summary for Q1/2024
Here is the scorecard of Spring Boot (left) and Quarkus (right) vs. Jakarta EE (100%), not on the card. The arrows show the trend vs. Jakarta EE.

Spring Boot pulls away from Jakarta EE everywhere except for job ad mentions. Quarkus gains on Jakarta EE everywhere.
Java Tech Popularity Index Q1/2024
What’s This?
Picking a popular technology makes our developer life easier. My free, quarterly newsletter measures Java technology popularity by following the money: job ads in 59 countries and online course purchases by 60+ million developers. I also analyze developer interest with Google searches and developer engagement with questions at Stack Overflow.
The Java technologies are: IDEs, build tools, JVM languages, databases, back-end frameworks, web frameworks, and mobile app frameworks. I also recommend options in each of these seven areas. My recommendations are based on that popularity, industry analysis, and my 25 years of Java experience.
Java Tech Popularity Index Q4/2023: Web Frameworks
Summary for Q4/2023
Here is the scorecard of React (left) and Vue (right) vs. Angular (100%), not on the card. The arrows show the trend vs. Angular.

React pulls away from Angular except for jobs where Angular edged closer in the last year. Vue holds steady or gains slightly against Angular, except for slight losses at Stack Overflow.
Java Tech Popularity Index Q4/2023: IDEs
Summary for Q4/2023
Here is the scorecard of VS Code (left) and Eclipse (right) vs. IntelliJ (100%), not on the card. The arrows show the trend vs. IntelliJ.

VS Code pulls away from IntelliJ in all categories but Udemy courses, where IntelliJ catches up ever so slightly. Eclipse loses ground to IntelliJ in all categories.
Java Tech Popularity Index Q4/2023: Front-End Mobile
Summary for Q4/2023
Here is the scorecard of React Native (left) and Xamarin (right) vs. Flutter (100%), not on the card. The arrows show the trend vs. Flutter.

React Native and Xamarin lose to Flutter in all categories.
Java Tech Popularity Index Q4/2023: Databases
Summary for Q4/2023
Here is the scorecard of MySql (left) and MongoDB (right) vs. Postgres (100%), not on the card. The arrows show the trend vs. Postgres.

MySQL gains jobs on Postgres but loses slightly (courses, searches) or heavily (Stack Overflow questions). MongoDB hold steady in job jobs but loses slightly everywhere else.
Java Tech Popularity Index Q4/2023: Build Tools
Summary for Q4/2023
Here is the scorecard of Maven (left) and Ant (right) vs. Gradle (100%), not on the card. The arrows show the trend vs. Gradle.

Maven loses to Gradle except for jobs, where it rises slightly. Ant has disappeared from searches and Stack Overflow and trends downwards in jobs.
Java Tech Popularity Index Q4/2023: Back-End Frameworks
Summary for Q4/2023
Here is the scorecard of Spring Boot (left) and Quarkus (right) vs. Jakarta EE (100%), not on the card. The arrows show the trend vs. Jakarta EE.

Spring Boot pulls away from Jakarta EE everywhere except for job ad mentions. Quarkus gains on Jakarta EE everywhere.
Java Tech Popularity Index Q4/2023
What’s This?
Picking a popular technology makes our developer life easier. My free, quarterly newsletter measures Java technology popularity by following the money: job ads in 59 countries and online course purchases by 60+ million developers. I also analyze developer interest with Google searches and developer engagement with questions at Stack Overflow.
Java Tech Popularity Index Q4/2023: JVM Languages
Summary for Q4/2023
Here is the scorecard of Java (left) and Scala (right) vs. Kotlin (100%), not on the card. The arrows show the trend vs. Kotlin.
Please take the Kotlin numbers with a huge grain of salt: Most Kotlin development is on Android, not in JVM projects. Java loses to Kotlin in all categories except for jobs. Scala declines against Kotlin in all categories (see the job ad section for why job numbers for Scala are missing).
Java Tech Popularity Index Q3/2023: Web Frameworks
Summary for Q3/2023
Here is the scorecard of React (left) and Vue (right) vs. Angular (100%), not on the card. The arrows show the trend vs. Angular.

React pulls away from Angular except for jobs where Angular edged closer in the last year. Vue holds steady or gains slightly against Angular.
Java Tech Popularity Index Q3/2023: JVM Languages
Summary for Q3/2023
Here is the scorecard of Java (left) and Scala (right) vs. Kotlin (100%), not on the card. The arrows show the trend vs. Kotlin.

Please take the Kotlin numbers with a huge grain of salt: Most Kotlin development is on Android, not in JVM projects. Kotlin gains on Java in all categories except for jobs. Scala declines against Kotlin in all categories (see the job ad section for why job numbers for Scala are missing).
Java Tech Popularity Index Q3/2023: IDEs
Summary for Q3/2023
Here is the scorecard of VS Code (left) and Eclipse (right) vs. IntelliJ (100%), not on the card. The arrows show the trend vs. IntelliJ.

VS Code pulls away from IntelliJ in all categories but Udemy courses, where IntelliJ catches up ever so slightly. Eclipse pulls away somewhat from IntelliJ in jobs but loses ground in all other categories.
Java Tech Popularity Index Q3/2023: Front-End Mobile
Summary for Q3/2023
Here is the scorecard of React Native (left) and Xamarin (right) vs. Flutter (100%), not on the card. The arrows show the trend vs. Flutter.

React Native and Xamarin lose to Flutter in all categories except installed apps.
Java Tech Popularity Index Q3/2023: Databases
Summary for Q3/2023
Here is the scorecard of MySql (left) and MongoDB (right) vs. Postgres (100%), not on the card. The arrows show the trend vs. Postgres.

MySQL gains jobs on Postgres but loses slightly (courses, searches) or heavily (Stack Overflow questions). MongoDB gains in jobs on Postgres, holds steady in searches, but loses slightly in courses and questions.
Java Tech Popularity Index Q3/2023: Build Tools
Summary for Q3/2023
Here is the scorecard of Maven (left) and Ant (right) vs. Gradle (100%), not on the card. The arrows show the trend vs. Gradle.

Maven holds steady against Gradle except for Stack Overflow. Ant has disappeared from searches and Stack Overflow and trends downwards in jobs.
Java Tech Popularity Index Q3/2023: Back-End Frameworks
Summary for Q3/2023
Here is the scorecard of Spring Boot (left) and Quarkus (right) vs. Jakarta EE (100%), not on the card. The arrows show the trend vs. Jakarta EE.

Spring Boot pulls away from Jakarta EE everywhere except for job ad mentions. Quarkus gains on Jakarta EE everywhere.
Java Tech Popularity Index Q3/2023
What’s This?
Picking a popular technology makes our developer life easier. My free, quarterly newsletter measures Java technology popularity by following the money: job ads in 59 countries and online course purchases by 60+ million developers. I also analyze developer interest with Google searches and developer engagement with questions at Stack Overflow.
Java Tech Popularity Index Q2/2023: Web Frameworks
Summary for Q2/2023
Here is the scorecard of Angular (100%), not on the card, vs. React (left) and Vue (right). The arrows show the trend vs. Angular.

React pulls away from Angular except for jobs where Angular surprisingly got closer in the last year. Vue holds steady or gains slightly against Angular.
Java Tech Popularity Index Q2/2023: JVM Languages
Summary for Q2/2023
Here is the scorecard of Kotlin (100%), not on the card, vs. Java (left) and Scala (right). The arrows show the trend vs. Kotlin.

Please take the Kotlin numbers with a huge grain of salt: Most Kotlin development is on Android, not in JVM projects. Kotlin gains on Java in all categories except for jobs. Scala declines against Kotlin in all categories (see the job ad section for why job numbers for Scala are missing).
Java Tech Popularity Index Q2/2023: IDEs
Summary for Q2/2023
Here is the scorecard of IntelliJ (100%), not on the card, vs. VS Code (left) and Eclipse (right). The arrows show the trend vs. IntelliJ.

VS Code pulls away from IntelliJ in all categories except Udemy courses. Eclipse pulls away slightly from IntelliJ in jobs but loses ground in all other categories.
Java Tech Popularity Index Q2/2023: Front-End Mobile
Summary for Q2/2023
Here is the scorecard of Flutter (100%), not on the card, vs. React Native (left) and Xamarin (right). The arrows show the trend vs. Flutter.

Flutter gains on its competitors in all categories but installed apps.
Java Tech Popularity Index Q2/2023: Databases
Summary for Q2/2023
Here is the scorecard of Postgres (100%), not on the card, vs. MySql (left) and MongoDB (right). The arrows show the trend vs. Postgres.

Postgres gains slightly on MySQL except for jobs where it loses slightly. MongoDB holds steady against Postgres except for questions where it also loses somewhat.
Java Tech Popularity Index Q2/2023: Build Tools
Summary for Q2/2023
Here is the scorecard of Gradle (100%), not on the card, vs. Maven (left) and Ant (right). The arrows show the trend vs. Gradle.

Maven holds steady against Gradle except for Stack Overflow. Ant holds up surprisingly well in jobs for its age but has disappeared from searches and Stack Overflow.
Java Tech Popularity Index Q2/2023: Back-End Frameworks
Summary for Q2/2023
Here is the scorecard of Jakarta EE (100%), not on the card, vs. Spring Boot (left) and Quarkus (right). The arrows show the trend vs. Jakarta EE.

Spring Boot pulls away from Jakarta EE everywhere except for job ad mentions, which have dropped by 21% since June 2022. Quarkus gains on Jakarta EE everywhere and pulls away in Stack Overflow questions.
Java Tech Popularity Index Q2/2023
What’s This?
My quarterly “Java Tech Popularity Index” measures the popularity of IDEs, build tools, JVM languages, databases, back-end frameworks, web frameworks, and mobile app frameworks with data from millions of developers: job ads from 59 countries, online training students, Stack Overflow questions, and Google searches.