Summary for Q1/2024
Here is the scorecard of React (left) and Vue (right) vs. Angular (100%), not on the card. The arrows show the trend vs. Angular.
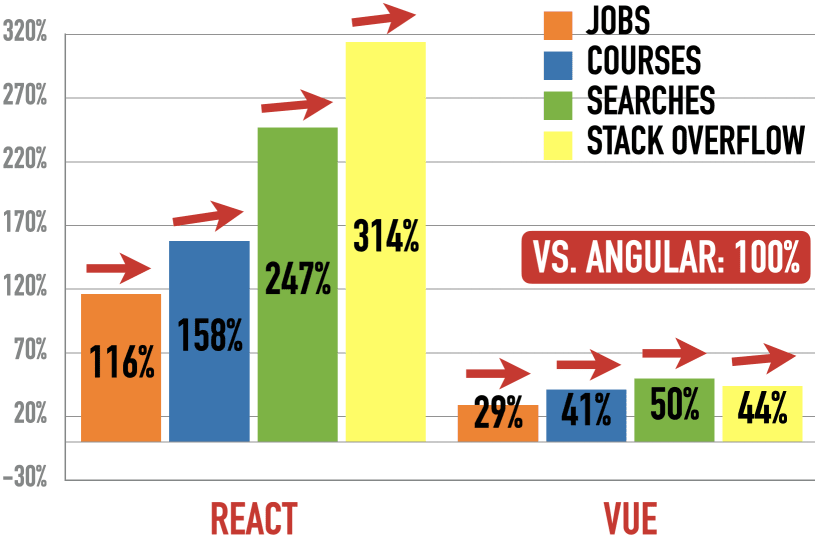
React pulls away from Angular except for jobs where React holds steady. Vue holds steady everywhere except for slight gains at Stack Overflow.
Here are my recommendations:
- If you already use React, Angular, or Vue in your project, keep using them. Otherwise, evaluate a migration. In many (most?) cases, such migration doesn’t make business sense.
- If you start a new project or migrate, start with React first, Angular otherwise, and finally, Vue.
Archive
| 2023 | Q4 | Q3 | Q2 | Q1 | ||||
| 2022 | Q4 | Q3 | Jun | May | Apr | Mar | Feb | Jan |
| 2021 | Dec | Nov |
Table Of Contents
Applications
These recommendations are for building web enterprise applications on PCs and mobile devices — forms, data grids, and reports. They are not for games or media applications.
Choices
- Google’s Angular
- Jakarta Server Faces (was JavaServer Faces)
- Facebook’s React
- Thymeleaf
- Vaadin
- Vue (“Vue.js” is the correct but longer name)
State-of-the-Art
Declarative UIs are state-of-the-art. Learn about it here.
Popularity
Why Popularity - and How?
Picking a popular technology makes our developer life easier: Easier to learn, easier to build, debug & deploy, easier to find jobs/hire, and easier to convince teammates & bosses. Popularity can make a difference in two situations: When multiple technologies score similarly, we could go for the most popular one. And when a technology is very unpopular, we may not use it.
I measure popularity among employers and developers as the trend between competing technologies. I count mentions in job ads at Indeed for employer popularity. For developer popularity, I use Google searches, Udemy course buyers, and Stack Overflow questions.
Employers: Job Ads
The Indeed job search is active in 62 countries. I picked 59 countries representing 69% of the worldwide GDP in 2022, excluding three countries because English word searches proved ineffective there: China, Japan, and South Korea. Job searches demonstrate the willingness of organizations to pay for a technology - the strongest indicator of popularity in my mind. Angular is the baseline.
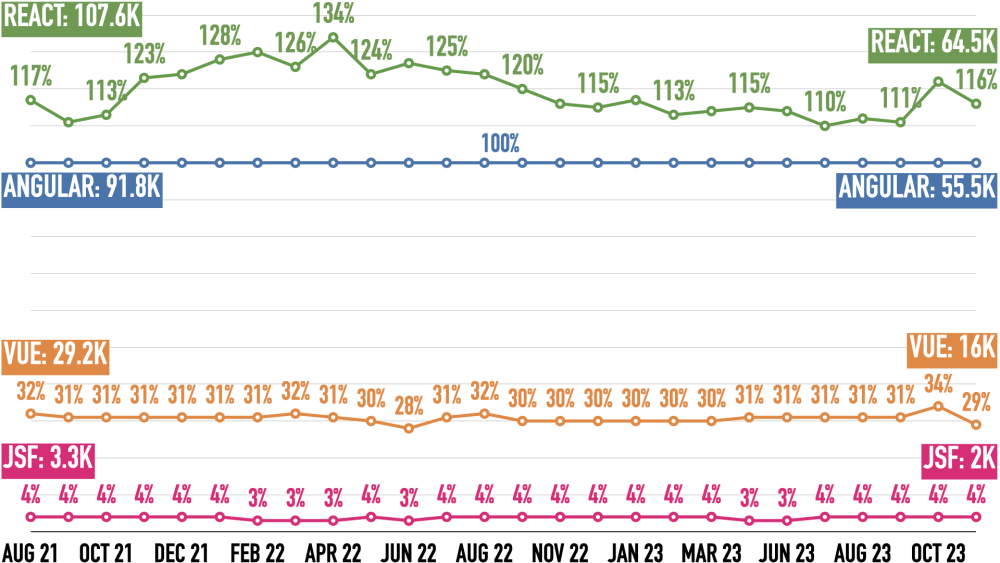
There are no job numbers for May and December 2023 because of changes on the Indeed websites.
React wins, Angular is second, Vue is third, and JSF is fourth. After peaking at 134% of Angular’s job ads in April 2022, React returns to where it started in August 2021. Vue is still around 30% of Angular’s mentions, and JSF still at 4%. With 0.2% and 0.5%, respectively, Thymeleaf and Vaadin are missing from the chart.
Comparing November 2023 vs. November 2022, job ads are down 32%.
Please see here for details, caveats, and adjustments to the job ad mentions.
You can find the detailed search results with links here. They include breakdowns by continents:
Developers
Students at Udemy
Udemy is one of the biggest online learning sites. They publish the number of people who bought a course (beyond a certain threshold, possibly around 100k). This shows how many people evaluate a technology. Angular is the baseline. The other frameworks don’t cross the reporting threshold for Students at Udemy (possibly around 100,000 students).
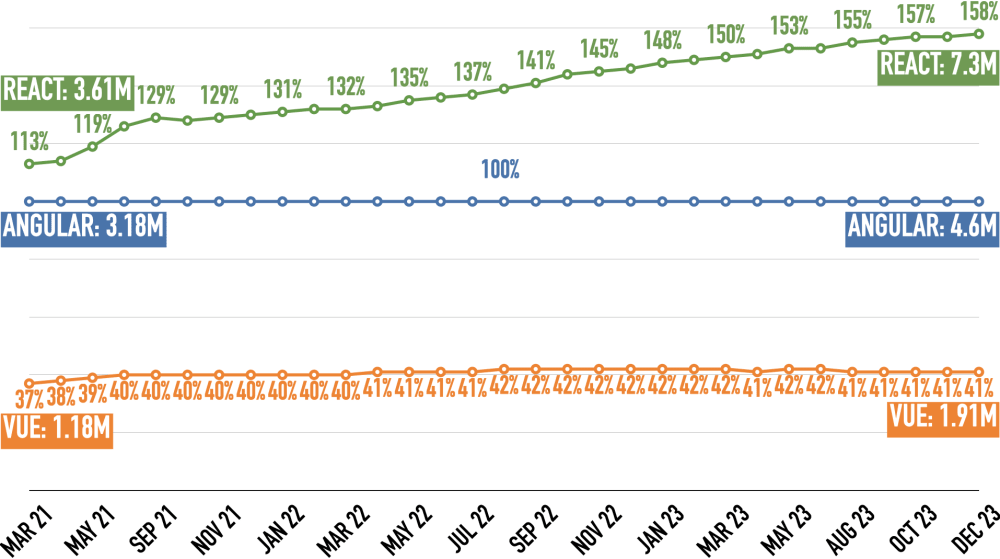
React wins, Angular is second, and Vue is third. React steadily pulls away from Angular, soon leading 1.6:1. Vue’s catch-up peaked at 42% of Angular at the end of 2022.
Here are the links that show the courses for all and the number of students for some:
Google Searches
Google Trends demonstrates the initial interest in a technology over time. Thymeleaf is missing from the list because Google only allows five search terms. “More searches = better” to me. The percentage behind the current value is the drop-off from the peak value, marked with a circle.
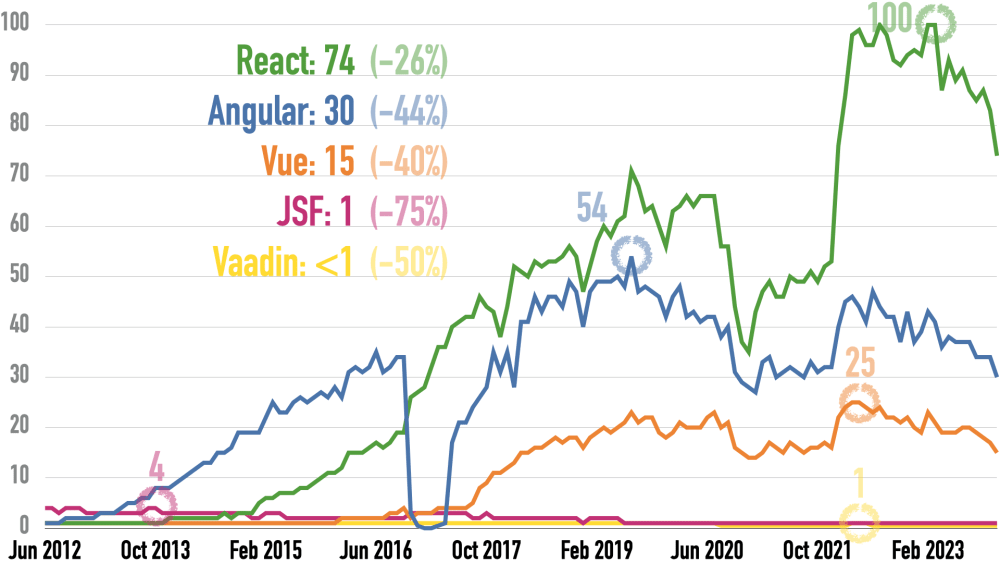
Google changed its measurement algorithms on January 1, 2016, and January 1, 2022. That caused spikes for all values, especially in 2022.
This link produces the chart above. Here’s a version with Thymeleaf instead of Vaadin: Thymeleaf also flat-lines.
React wins, Angular is second, and Vue is third. Google searches always decline in December. React leads Angular 2.5:1. Vue has half of Angular’s volume. All other frameworks are insignificant today against these three.
Monthly Questions at Stack Overflow
We can run database queries against the questions, answers, and comments at Stack Overflow with the StackExchange Data Explorer. The number of monthly questions is a proxy for using a technology during evaluation and productive use. This number includes deleted questions to be more accurate, as Stack Overflow automatically deletes questions without answers after a year. “More questions = better” to me. The percentage behind the current value is the drop-off from the peak value, marked with a circle.
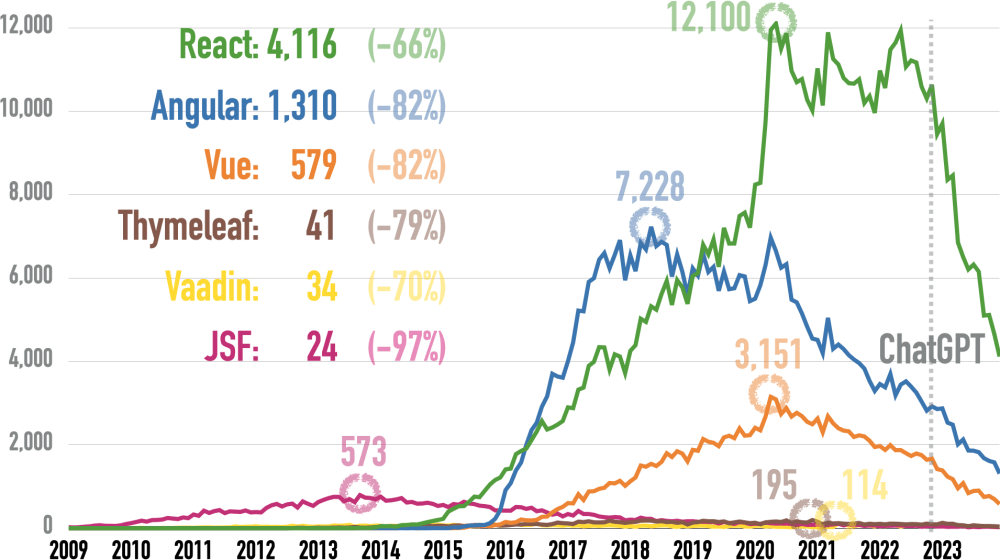
React wins, Angular is second, and Vue is third. React lost 61% since ChatGPT, Angular 55. Still, React leads Angular 3.1:1 Vue has slightly less than half of Angular’s questions. JSF, Vaadin, and Thymeleaf barely register against the “Big Three”.
I used two queries to get the number of monthly questions below because putting all in one query timed out. You can run them in the StackExchange Data Explorer.
(Click to expand) Query 1: Angular, React, and Vue
DECLARE @StartDate DATE = '2009-01-01';
DECLARE @EndDate DATE = '2023-12-31';

WITH TaggedQuestions AS (
  SELECT
    Id,
    CreationDate,
    CASE WHEN CHARINDEX('<reactjs>', Tags) > 0 THEN 1 ELSE 0 END AS ReactTag,
    CASE WHEN CHARINDEX('<angular>', Tags) > 0 THEN 1 ELSE 0 END AS AngularTag,
    CASE WHEN CHARINDEX('<vue.js>', Tags) > 0 THEN 1 ELSE 0 END AS VueTag
  FROM PostsWithDeleted
  WHERE
    PostTypeId = 1 AND
    CreationDate >= @StartDate AND
    CreationDate <= @EndDate
),
MonthlyCounts AS (
  SELECT
    DATEADD(month, DATEDIFF(month, 0, CreationDate), 0) AS Month,
    SUM(ReactTag) AS React,
    SUM(AngularTag) AS Angular,
    SUM(VueTag) AS Vue
  FROM TaggedQuestions
  GROUP BY DATEADD(month, DATEDIFF(month, 0, CreationDate), 0)
)
SELECT
  Month,
  React,
  Angular,
  Vue
FROM MonthlyCounts
ORDER BY Month;
(Click to expand) Query 2: JSF, Thymeleaf, and Vaadin
DECLARE @StartDate DATE = '2009-01-01';
DECLARE @EndDate DATE = '2023-12-31';

WITH TaggedQuestions AS (
  SELECT
    Id,
    CreationDate,
    CASE WHEN CHARINDEX('<thymeleaf>', Tags) > 0 THEN 1 ELSE 0 END AS ThymeleafTag,
    CASE WHEN CHARINDEX('<jsf>', Tags) > 0 THEN 1 ELSE 0 END AS JSFTag,
    CASE WHEN CHARINDEX('<vaadin>', Tags) > 0 THEN 1 ELSE 0 END AS VaadinTag
  FROM PostsWithDeleted
  WHERE
    PostTypeId = 1 AND
    CreationDate >= @StartDate AND
    CreationDate <= @EndDate
),
MonthlyCounts AS (
  SELECT
    DATEADD(month, DATEDIFF(month, 0, CreationDate), 0) AS Month,
    SUM(ThymeleafTag) AS Thymeleaf,
    SUM(JSFTag) AS JSF,
    SUM(VaadinTag) AS Vaadin
  FROM TaggedQuestions
  GROUP BY DATEADD(month, DATEDIFF(month, 0, CreationDate), 0)
)
SELECT
  Month,
  Thymeleaf,
  JSF,
  Vaadin
FROM MonthlyCounts
ORDER BY Month;
Please note that the overall monthly number of Stack Overflow questions is down 55% since ChatGPT appeared (November 2022 vs. March 2024):

You can run the query below at the StackExchange Data Explorer.
(Click to expand) Query 3: All Questions
DECLARE @StartDate DATE = '2009-01-01';
DECLARE @EndDate DATE = '2024-03-31';

WITH Questions AS (
  SELECT
    Id,
    CreationDate,
    1 AS AQuestion
  FROM PostsWithDeleted
  WHERE
    PostTypeId = 1 AND
    CreationDate >= @StartDate AND
    CreationDate <= @EndDate
),
MonthlyCounts AS (
  SELECT
    DATEADD(month, DATEDIFF(month, 0, CreationDate), 0) AS Month,
    SUM(AQuestion) AS Questions
  FROM Questions
  GROUP BY DATEADD(month, DATEDIFF(month, 0, CreationDate), 0)
)
SELECT
  Month,
  Questions
FROM MonthlyCounts
ORDER BY Month;
Analysis
I use the following criteria to recommend one of the three choices - Angular, React, and Vue:
- Java: Angular wins here because it uses Typescript by default. Typescript is closer to Java than plain JavaScript.
- Declarative: Declarative is state-of-the-art for front-end development. Please see my guide for it. React uses it by default. Angular does not, so React wins.
- Safe: Google has the image of killing projects and has multiple competing front-end frameworks. That’s why I’m more confident that React will still be around in five years.
- Popular: As you can see above, React is the most popular framework.
- Web functionality: It’s a draw, as all three frameworks can build the applications we need.
- Libraries: I don’t know which of these three frameworks has the most and best libraries. I think many libraries work in all three.
- Speed: I think you can build the fastest applications with React because it has features to speed up the concurrent loading of components.
- Build, Deploy & Debug: I don’t know which frameworks have the shortest build & deploy cycle and the best debug experience.
Based on these criteria and my ratings, React is the winner, Angular second, and Vue third. My recommendation is this:
- If you already use React, Angular, or Vue in your project, keep using them.
- If you use another framework, investigate migration to React first, then Angular, and finally Vue. In many (most?) cases, such migration doesn’t make business sense.
- If you start a new project, start with React first, Angular otherwise, and finally, Vue.
Next Issue
The next issue will arrive in June 2024. Subscribe to it as a newsletter to have it in your inbox then!