Summary for Q1/2024
Here is the scorecard of VS Code (left) and Eclipse (right) vs. IntelliJ (100%), not on the card. The arrows show the trend vs. IntelliJ.
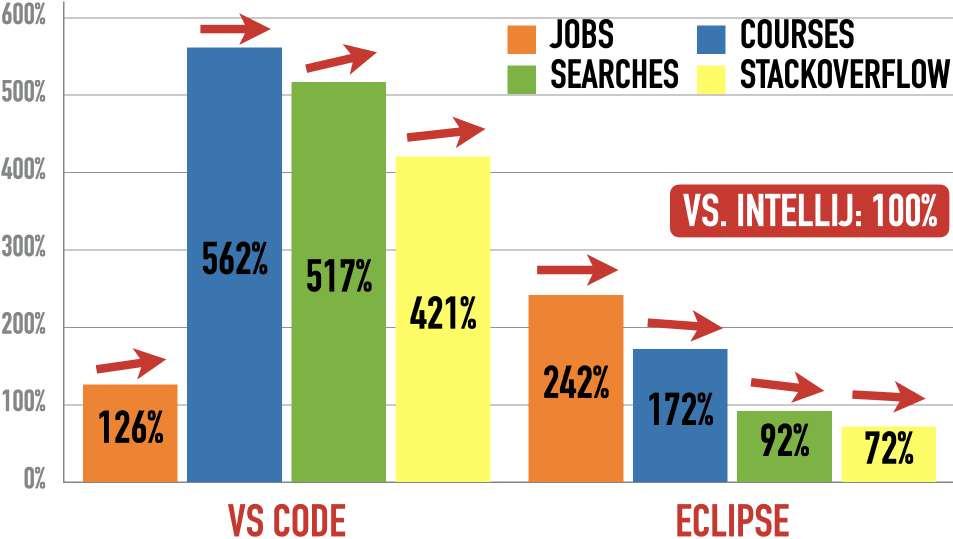
VS Code pulls away from IntelliJ in all categories except Udemy courses. Eclipse loses ground to IntelliJ in all categories.
Here are my recommendations:
- Use an AI code assistant in your IDE.
- If you don’t want to spend money, use IntelliJ Community Edition.
- If you may spend money, evaluate IntelliJ Ultimate Edition.
- Evaluate VS Code for non-Java work, like web development (I use it for all my websites).
- If you use Eclipse or NetBeans, evaluate IntelliJ or VS Code, as they have AI assistants.
Archive
| 2023 | Q4 | Q3 | Q2 |
| 2022 | Q4 | Q3 |
Table Of Contents
Choices
Here are the choices in alphabetical order:
- Eclipse IDE
- IntelliJ IDEA
- NetBeans
- Visual Studio Code (“VS Code”)
Please note:
- IntelliJ is the only commercial IDE on this list. The free Community edition lacks crucial features of the Ultimate Edition, such as tools for Spring, Jakarta EE, and web development. Please see here for pricing. You can also buy the “All Products Pack”, which may be a better value (I use DataGrip for databases).
- Microsoft doesn’t position VS Code as a fully-fledged IDE and says it is “not made to compete with IntelliJ directly in that realm”. Still, one in five Java developers uses VS Code.
Popularity
Why Popularity - and How?
Picking a popular technology makes our developer life easier: Easier to learn, easier to build, debug & deploy, easier to find jobs/hire, and easier to convince teammates & bosses. Popularity can make a difference in two situations: When multiple technologies score similarly, we could go for the most popular one. And when a technology is very unpopular, we may not use it.
I measure popularity among employers and developers as the trend between competing technologies. I count mentions in job ads at Indeed for employer popularity. For developer popularity, I use Google searches, Udemy course buyers, and Stack Overflow questions.
Employers: Job Ads
The Indeed job search is active in 62 countries. I picked 59 countries representing 69% of the worldwide GDP in 2022, excluding three countries because English word searches proved ineffective there: China, Japan, and South Korea. Job searches demonstrate the willingness of organizations to pay for a technology - the strongest indicator of popularity in my mind. IntelliJ is the baseline.

The Eclipse numbers are too high, as Eclipse also has many frameworks. Search only for “Eclipse IDE” would exclude many ads that just refer to the Eclipse IDE as “Eclipse”. I may adjust this in the future. There are no job numbers for May and December 2023 because of changes on the Indeed websites.
Eclipse wins, VS Code is second, IntelliJ is third, and NetBeans last. Eclipse is back to where it was in June 2022 at 242% of IntelliJ. VS Code hits its all-time high at 126% of IntelliJ. NetBeans hovers around 20% of the IntelliJ ad mentions.
Comparing November 2023 vs. November 2022, job ads are down 32%.
Please see here for details, caveats, and adjustments to the job ad mentions.
You can find the detailed search results with links here. They include breakdowns by continents:
Developers
Students at Udemy
Udemy is one of the biggest online learning sites. They publish the number of people who bought a course (beyond a certain threshold, possibly around 100k). This shows how many people evaluate a technology. This time, Eclipse is the baseline.
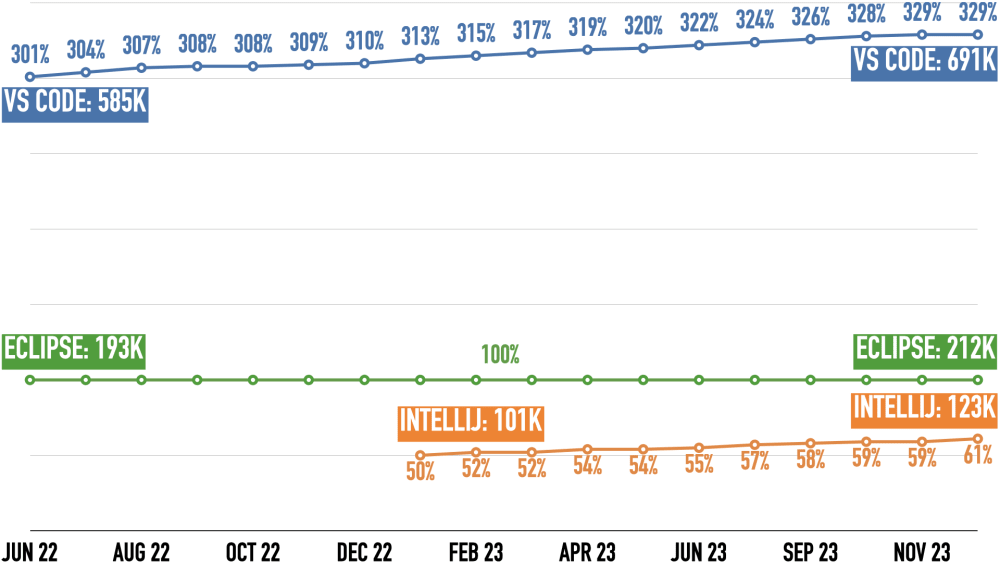
VS Code wins, Eclipse is second, and IntelliJ is third. VS Code leads Eclipse nearly 3.3:1 and steadily pulls away. Since January 2023, IntelliJ increased from 50% of Eclipse’s students to 61%. NetBeans does not have enough students for Udemy to reveal their numbers.
Here are the links that show the courses for all and the number of students for some:
Google Searches
Google Trends demonstrates the initial interest in a technology over time. “More searches = better” to me. The percentage behind the current value is the drop-off from the peak value, marked with a circle.
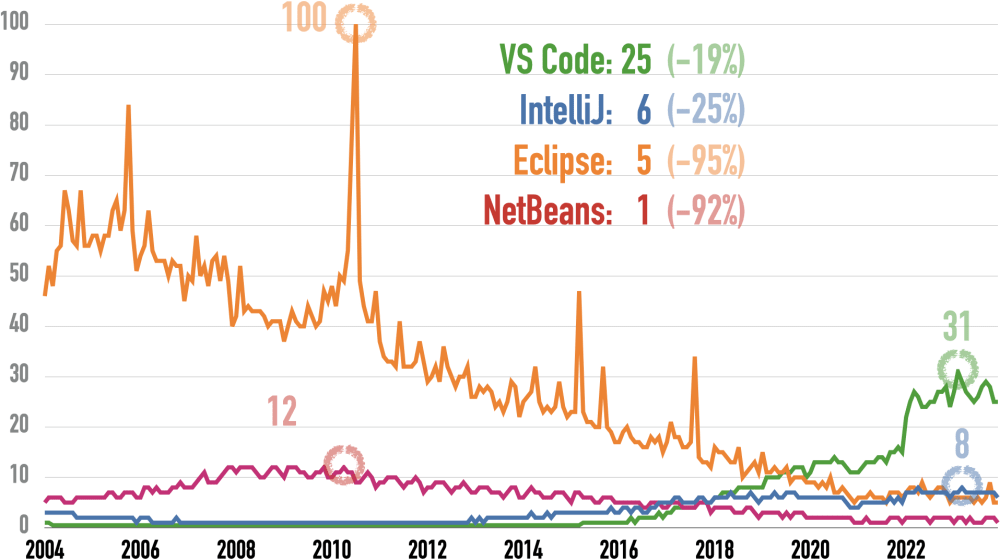
Google changed its measurement algorithms on January 1, 2016, and January 1, 2022. That caused spikes for all values, especially in 2022.
This link produces the chart above.
Eclipse and NetBeans have long declined, since 2005 and 2008, respectively. VS Code has risen significantly over the last few years, while IntelliJ rose slightly and has been neck-to-neck with Eclipse for 1.5 years. Let’s zoom in on the previous three years:
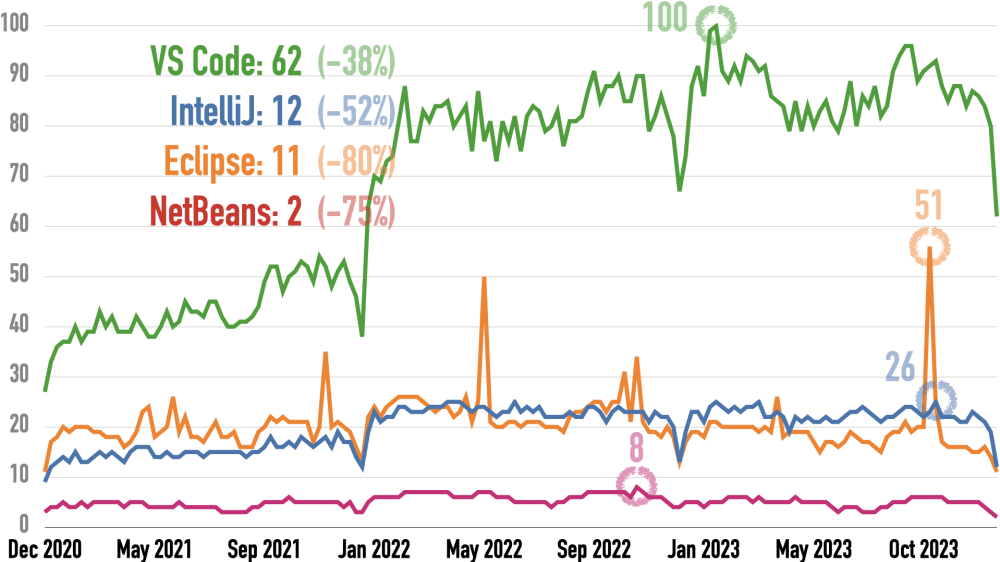
Google changed its measurement algorithms on January 1, 2022. That caused spikes for all values.
This link produces the chart above.
VS Code wins, IntelliJ is second, Eclipse is third, and NetBeans is fourth. Google searches always decline in December. VS Code has leads IntelliJ 5:1. Eclipse has spikes around its quarterly releases but is back to its value from three years ago. IntelliJ has been mostly ahead of Eclipse for the last year but is now back to its 2020 starting value. NetBeans is flat overall at a third of Eclipse’s numbers.
Monthly Questions at Stack Overflow
We can run database queries against the questions, answers, and comments at Stack Overflow with the StackExchange Data Explorer. The number of monthly questions is a proxy for using a technology during evaluation and productive use. This number includes deleted questions to be more accurate, as Stack Overflow automatically deletes questions without answers after a year. “More questions = better” to me. The percentage behind the current value is the drop-off from the peak value, marked with a circle.
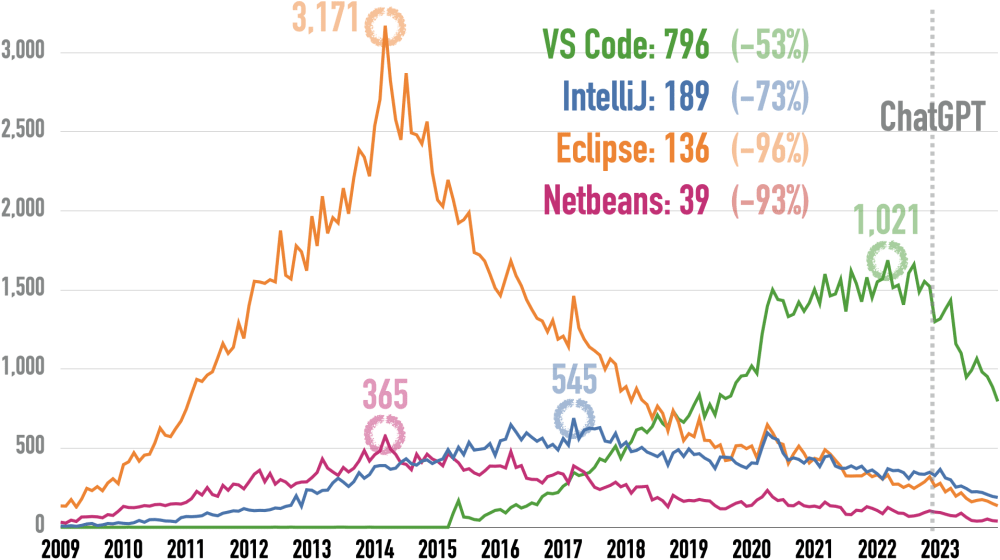
VS Code wins, IntelliJ is second, Eclipse is third, and NetBeans is fourth. VS Code lost half its questions since ChatGPT but still leads IntelliJ 4.2:1. IntelliJ has declined for nearly eight years to just 27% of its peak value but has been ahead of Eclipse for two years. Eclipse and NetBeans have declined for over nine years, now at 4% (Eclipse) and 7% (NetBeans) of their peak value. Eclipse has 72% of IntelliJ’s questions, while NetBeans has only 21%.
You can run the query below at the StackExchange Data Explorer to get this :
(Click to expand) Query 1: Eclipse and IntelliJ
DECLARE @StartDate DATE = '2009-01-01';
DECLARE @EndDate DATE = '2023-12-31';

WITH Tagged AS (
  SELECT
    Id,
    CreationDate,
    CASE WHEN CHARINDEX('<intellij-idea>', Tags) > 0 THEN 1 ELSE 0 END AS IntelliJTag,
    CASE WHEN CHARINDEX('<eclipse>', Tags) > 0 THEN 1 ELSE 0 END AS EclipseTag
  FROM PostsWithDeleted
  WHERE
    PostTypeId = 1 AND -- 1 for
    CreationDate >= @StartDate AND
    CreationDate <= @EndDate
),
MonthlyCounts AS (
  SELECT
    DATEADD(month, DATEDIFF(month, 0, CreationDate), 0) AS Month,
    SUM(IntelliJTag) AS IntelliJ,
    SUM(EclipseTag) AS Eclipse
  FROM Tagged
  GROUP BY DATEADD(month, DATEDIFF(month, 0, CreationDate), 0)
)
SELECT
  Month,
  IntelliJ,
  Eclipse
FROM MonthlyCounts
ORDER BY Month;
(Click to expand) Query 2: NetBeans and VS Code
DECLARE @StartDate DATE = '2009-01-01';
DECLARE @EndDate DATE = '2023-12-31';

WITH Tagged AS (
  SELECT
    Id,
    CreationDate,
    CASE WHEN CHARINDEX('<netbeans>', Tags) > 0 THEN 1 ELSE 0 END AS NetbeansTag,
    CASE WHEN CHARINDEX('<visual-studio-code>', Tags) > 0 THEN 1 ELSE 0 END AS VSCodeTag
  FROM PostsWithDeleted
  WHERE
    PostTypeId = 1 AND -- 1 for
    CreationDate >= @StartDate AND
    CreationDate <= @EndDate
),
MonthlyCounts AS (
  SELECT
    DATEADD(month, DATEDIFF(month, 0, CreationDate), 0) AS Month,
    SUM(NetbeansTag) AS Netbeans,
    SUM(VSCodeTag) AS VSCode
  FROM Tagged
  GROUP BY DATEADD(month, DATEDIFF(month, 0, CreationDate), 0)
)
SELECT
  Month,
  Netbeans,
  VSCode
FROM MonthlyCounts
ORDER BY Month;
Please note that the overall monthly number of Stack Overflow questions is down 55% since ChatGPT appeared (November 2022 vs. March 2024):

You can run the query below at the StackExchange Data Explorer.
(Click to expand) Query 3: All Questions
DECLARE @StartDate DATE = '2009-01-01';
DECLARE @EndDate DATE = '2024-03-31';

WITH Questions AS (
  SELECT
    Id,
    CreationDate,
    1 AS AQuestion
  FROM PostsWithDeleted
  WHERE
    PostTypeId = 1 AND
    CreationDate >= @StartDate AND
    CreationDate <= @EndDate
),
MonthlyCounts AS (
  SELECT
    DATEADD(month, DATEDIFF(month, 0, CreationDate), 0) AS Month,
    SUM(AQuestion) AS Questions
  FROM Questions
  GROUP BY DATEADD(month, DATEDIFF(month, 0, CreationDate), 0)
)
SELECT
  Month,
  Questions
FROM MonthlyCounts
ORDER BY Month;
Analysis
- Eclipse: Despite its decline, it’s still the most popular free Java IDE. The free IntelliJ Community Edition is no competition as it lacks support for back-end frameworks like Spring or Jakarta EE and web frameworks. But the cracks still show: In Stack Overflow’s “2023 Developer Survey”, only 28% of its users want to continue using it (“admire”). And only 3% want to start using it (“desire”). So Eclipse has a VS Code competitor in the works.
- IntelliJ: In a world where everybody and their dog offer us free development tools, IntelliJ Ultimate Edition stands out as a product people are willing to pay for. Why? Because developers are happy with it: In Stack Overflow’s “2023 Developer Survey”, 66% of its users want to continue using it. And 203% want to start using it. That makes it the most-liked commercial IDE and the #2 most-liked IDE behind VS Code. Still, JetBrains also works on a VS Code clone.
- NetBeans: Moving from Sun to Oracle to Apache hasn’t done the oldest Java IDE in this list any good. It competes against the much more popular Eclipse IDE, not to mention VS Code. Feature-wise, there isn’t anything really to set NetBeans apart from Eclipse. And in Stack Overflow’s “2023 Developer Survey”, only 24% of its users want to continue using it. That’s the third-lowest score. Only 1% want to start using it. That’s the worst Java IDE score there. A low popularity also means getting fewer plugins than the other IDEs.
- VS Code: It may not be a fully-fledged Java IDE. But it is something we developers have never had - a free, fast, cross-platform, cross-language IDE. And developers love it: In Stack Overflow’s “2023 Developer Survey”, 77% of its users want to continue using it – the third-highest score. And a whopping 59% want to start using it – three times as much as the #2 (IntelliJ).
I have recommended Eclipse as the IDE so far. That’s changing with this issue. Why? Because AI: The AI code assistants from Microsoft, Google, and Amazon only support IntelliJ and VS Code. And I think that you need to use an AI code assistant because “AI won’t take your job. It’s somebody using AI that will take your job”, as a smarter person than me said.
So here’s my recommendation:
- Use an AI code assistant in your IDE.
- If you don’t want to spend money, use IntelliJ Community Edition.
- If you may spend money, evaluate IntelliJ Ultimate Edition.
- Evaluate VS Code for non-Java work, like web development (I use it for all my websites).
- If you use Eclipse or NetBeans, evaluate IntelliJ or VS Code, as they have AI assistants.
Next Issue
The next issue will arrive in June 2024. Subscribe to it as a newsletter to have it in your inbox then!