Summary for Q1/2024
Here is the scorecard of React Native (left) and Xamarin (right) vs. Flutter (100%), not on the card. The arrows show the trend vs. Flutter.
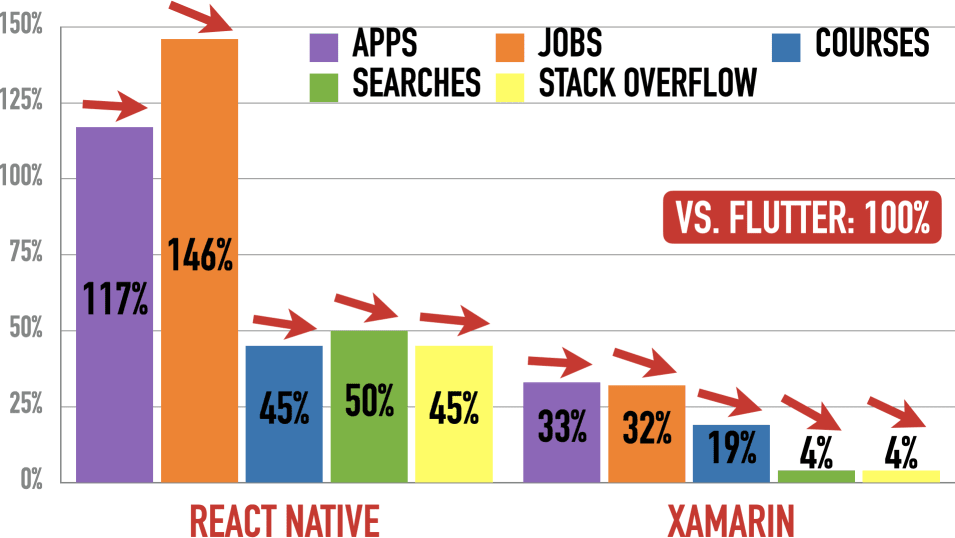
React Native and Xamarin lose to Flutter in all categories.
Here are my recommendations:
- Don’t build two separate applications with Apple’s and Google’s first-party frameworks. Use a cross-platform framework instead.
- If you already use Flutter or React Native in your project, keep using them. Otherwise, evaluate a migration. In many (most?) cases, such migration doesn’t make business sense.
- If you start a new project or migrate and have used React before, start with React Native first and use Flutter otherwise.
- If you start a new project or migrate and have not used React, begin with Flutter first and use React Native otherwise.
Archive
| 2023 | Q4 | Q3 | Q2 | Q1 | ||||
| 2022 | Q4 | Q3 | Jun | May | Apr | Mar | Feb | Jan |
| 2021 | Dec | Nov |
Table Of Contents
Applications
These recommendations are for building native enterprise applications on iOS and Android - forms, data grids, and reports. They are not for games or media applications.
Choices
Here are the choices in alphabetical order:
State of the Art
Declarative UIs are state-of-the-art. Learn about it here.
Popularity
Why Popularity - and How?
Picking a popular technology makes our developer life easier: Easier to learn, easier to build, debug & deploy, easier to find jobs/hire, and easier to convince teammates & bosses. Popularity can make a difference in two situations: When multiple technologies score similarly, we could go for the most popular one. And when a technology is very unpopular, we may not use it.
I measure popularity among employers and developers as the trend between competing technologies. I count mentions in job ads at Indeed for employer popularity. For developer popularity, I use Google searches, Udemy course buyers, and Stack Overflow questions.
Installed Base
The mobile analytics company appfigures analyzes all apps in the Apple App Store and the Google Play Store. That’s why they can publish a list of how many apps use a particular technology. JavaFX isn’t on the list because it has a <1% market share. So here are the results for the other three frameworks:
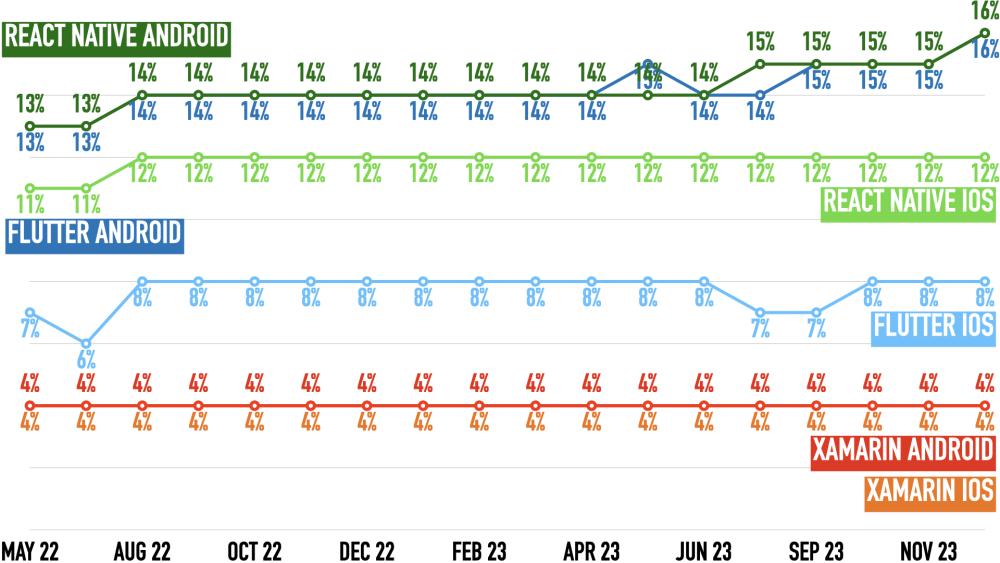
React Native wins, Flutters is second, and Xamarin is third. React Native and Flutter have the same share on Android. However, on iOS, React Native leads Flutter by 71%. Xamarin holds steady with 4% on iOS and Android.
Employers: Job Ads
The Indeed job search is active in 62 countries. I picked 59 countries representing 69% of the worldwide GDP in 2022, excluding three countries because English word searches proved ineffective there: China, Japan, and South Korea. Job searches demonstrate the willingness of organizations to pay for a technology - the strongest indicator of popularity in my mind. Flutter is the baseline.
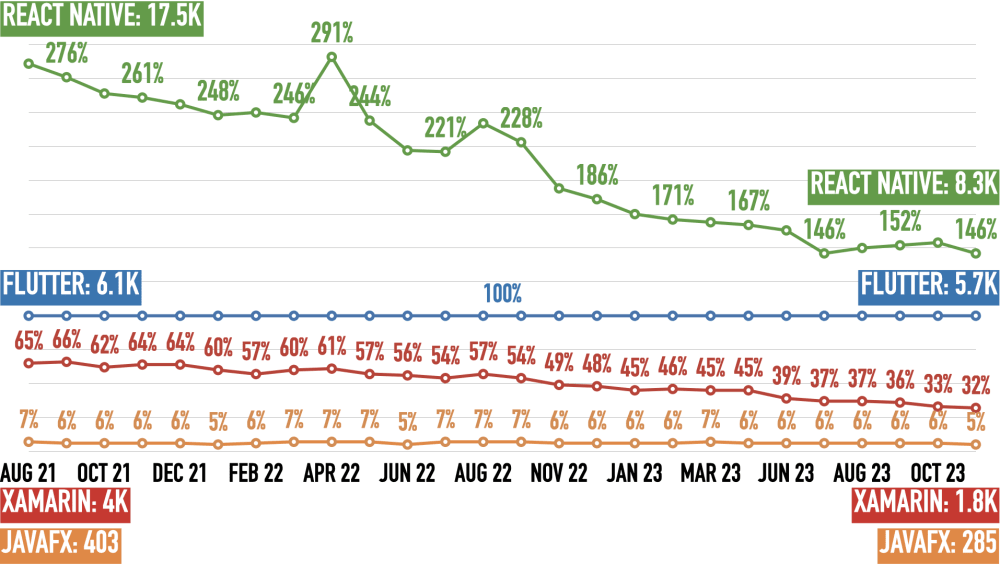
There are no job numbers for May and December 2023 because of changes on the Indeed websites.
React Native wins, Flutters is second, Xamarin is third, and JavaFX last. React Native halved its number of mentions in one and a half years. Xamarin lost half of its mentions against Flutter since August 2021. JavaFX held steady against Flutter, around 6%.
Comparing November 2023 vs. November 2022, job ads are down 32%.
Please see here for details, caveats, and adjustments to the job ad mentions.
You can find the detailed search results with links here. They include breakdowns by continents:
Developers
Students at Udemy
Udemy is one of the biggest online learning sites. They publish the number of people who bought a course (beyond a certain threshold, possibly around 100k). This shows how many people evaluate a technology. This time, React Native is the baseline. The percentage behind the current value is the drop-off from the peak value, marked with a circle.
Flutter wins, React Native is second, Xamarin is third, and JavaFX is fourth. Since 2022, Flutter steadily increased its lead over React Native but has slowed in recent months and now leads React Native 2.2:1. Xamarin dropped from 30% of React Native’s values to just 19%. After a slight dip to 15%, JavaFX is now back to 16% of React Native’s students.
Here are the links that show the courses for all and the number of students for some:
Google Searches
Google Trends demonstrates the initial interest in a technology over time. “More searches = better” to me. The percentage behind the current value is the drop-off from the peak value, marked with a circle.
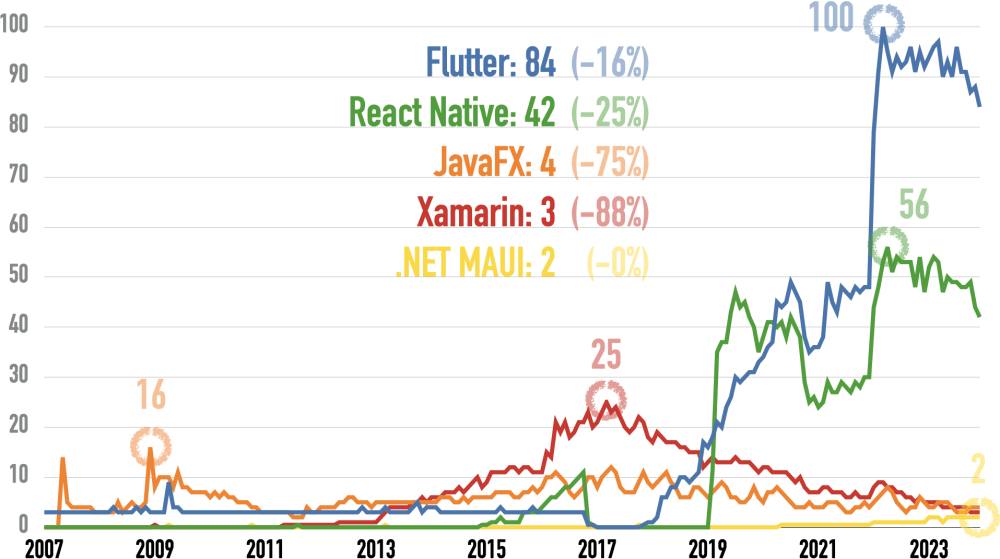
Google changed its measurement algorithms on January 1, 2016, and January 1, 2022. That caused spikes for all values, especially in 2022.
This link produces the chart above.
Flutter wins, React Native is second, Xamarin is third, and JavaFX is fourth. Google searches always decline in December. Flutter has twice the searches that React Native has. JavaFX and Xamarin have declined for six years. .NET MAUI, Microsoft’s “Xamarin rewrite”, may reach the #3 spot in 2024.
Monthly Questions at Stack Overflow
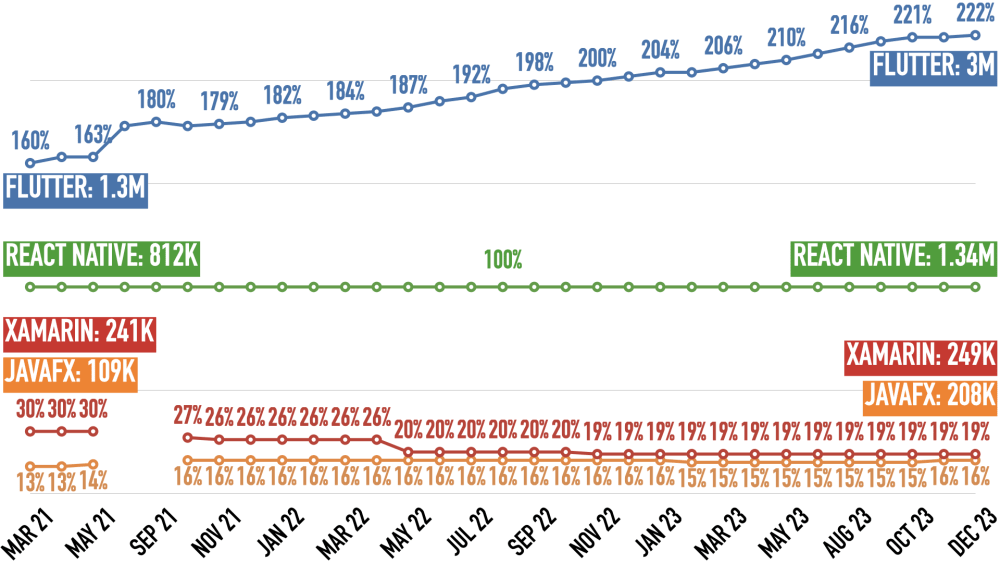
We can run database queries against the questions, answers, and comments at Stack Overflow with the StackExchange Data Explorer. The number of monthly questions is a proxy for using a technology during evaluation and productive use. This number includes deleted questions to be more accurate, as Stack Overflow automatically deletes questions without answers after a year. “More questions = better” to me. The percentage behind the current value is the drop-off from the peak value, marked with a circle.

Flutter wins, React Native is second, Xamarin is third, and JavaFX is fourth. Flutter leads React Native 2.2:1. Both dropped more than half their questions since ChatGPT appeared, in line with Stack Overflow’s overall decline. JavaFX and Xamarin have declined for 4-5 years. .NET MAUI, the “Xamarin rewrite”, leads its predecessor Xamarin 3.8:1 but peaked in March this year.
I used two queries to get the number of monthly questions below because putting all in one query timed out. You can run them in the StackExchange Data Explorer.
(Click to expand) Query 1: Flutter, JavaFX, and React Native
DECLARE @StartDate DATE = '2009-01-01';
DECLARE @EndDate DATE = '2023-12-31';

WITH TaggedQuestions AS (
  SELECT
    Id,
    CreationDate,
    CASE WHEN CHARINDEX('<flutter>', Tags) > 0 THEN 1 ELSE 0 END AS FlutterTag,
    CASE WHEN CHARINDEX('<react-native>', Tags) > 0 THEN 1 ELSE 0 END AS ReactNativeTag,
    CASE WHEN CHARINDEX('<javafx>', Tags) > 0 THEN 1 ELSE 0 END AS JavaFXTag
  FROM PostsWithDeleted
  WHERE
    PostTypeId = 1 AND
    CreationDate >= @StartDate AND
    CreationDate <= @EndDate
),
MonthlyCounts AS (
  SELECT
    DATEADD(month, DATEDIFF(month, 0, CreationDate), 0) AS Month,
    SUM(FlutterTag) AS Flutter,
    SUM(ReactNativeTag) AS ReactNative,
    SUM(JavaFXTag) AS JavaFX
  FROM TaggedQuestions
  GROUP BY DATEADD(month, DATEDIFF(month, 0, CreationDate), 0)
)
SELECT
  Month,
  Flutter,
  ReactNative,
  JavaFX
FROM MonthlyCounts
ORDER BY Month;
(Click to expand) Query 2: .NET MAUI and Xamarin
DECLARE @StartDate DATE = '2009-01-01';
DECLARE @EndDate DATE = '2023-12-31';

WITH TaggedQuestions AS (
  SELECT
    Id,
    CreationDate,
    CASE WHEN CHARINDEX('<xamarin>', Tags) > 0 THEN 1 ELSE 0 END AS XamarinTag,
    CASE WHEN CHARINDEX('<maui>', Tags) > 0 THEN 1 ELSE 0 END AS NetMAUITag
  FROM PostsWithDeleted
  WHERE
    PostTypeId = 1 AND
    CreationDate >= @StartDate AND
    CreationDate <= @EndDate
),
MonthlyCounts AS (
  SELECT
    DATEADD(month, DATEDIFF(month, 0, CreationDate), 0) AS Month,
    SUM(XamarinTag) AS Xamarin,
    SUM(NetMAUITag) AS NetMAUI
  FROM TaggedQuestions
  GROUP BY DATEADD(month, DATEDIFF(month, 0, CreationDate), 0)
)
SELECT
  Month,
  Xamarin,
  NetMAUI
FROM MonthlyCounts
ORDER BY Month;
Please note that the overall monthly number of Stack Overflow questions is down 55% since ChatGPT appeared (November 2022 vs. March 2024):

You can run the query below at the StackExchange Data Explorer.
(Click to expand) Query 3: All Questions
DECLARE @StartDate DATE = '2009-01-01';
DECLARE @EndDate DATE = '2024-03-31';

WITH Questions AS (
  SELECT
    Id,
    CreationDate,
    1 AS AQuestion
  FROM PostsWithDeleted
  WHERE
    PostTypeId = 1 AND
    CreationDate >= @StartDate AND
    CreationDate <= @EndDate
),
MonthlyCounts AS (
  SELECT
    DATEADD(month, DATEDIFF(month, 0, CreationDate), 0) AS Month,
    SUM(AQuestion) AS Questions
  FROM Questions
  GROUP BY DATEADD(month, DATEDIFF(month, 0, CreationDate), 0)
)
SELECT
  Month,
  Questions
FROM MonthlyCounts
ORDER BY Month;
Analysis
I use the following criteria to recommend one of the two choices - Flutter and React Native:
- Java: Flutter wins here because its language, Dart, is very similar to Java. React Native uses JavaScript instead.
- Declarative: Declarative is state-of-the-art for front-end development. It’s a draw because both frameworks work this way.
- Safe: Google has the image of killing projects and has multiple competing front-end frameworks. Although I think Flutter will be around, convincing your teammates and boss may be challenging! That’s why React Native is my winner here.
- Popular: Flutter leads in three of the four popularity indicators but crucially loses in jobs — globally, there are 1.7 times as many for React Native. That’s why I declare React Native to be more popular.
- Mobile functionality: It’s a draw as both frameworks can build the applications we need.
- Libraries: I don’t know which of these two frameworks has the most and best libraries.
- Speed: Flutter is faster because it has a native render engine. In React Native, rendering has to pass a JavaScript bridge.
- Native Functionality: Flutter is the winner here: It has many plug-ins that provide easy access to native functionality (like the camera or pictures), can show native screens, has channels for publish-and-subscribe communication with native code, and has a C API to top it all off.
- 1 Codebase: It’s a draw because both have one.
- Build, Deploy & Debug: I don’t know which frameworks have the shortest build & deploy cycle and the best debug experience.
Based on these criteria and my ratings, Flutter is the winner, and React Native is second. That’s why my recommendation is:
- Don’t build two separate applications with Apple’s and Google’s first-party frameworks. Use a cross-platform framework instead.
- If you already use Flutter or React Native in your project, keep using them. Otherwise, evaluate a migration. In many (most?) cases, such migration doesn’t make business sense.
- If you start a new project and have used React to build web applications, then use React Native.
- If you start a new project and have .NET experience, use .NET MAUI.
- If you start a new project and need to use a library only available in Java, use JavaFX.
- Otherwise, start with Flutter first and use React Native if that doesn’t work out for you.
Next Issue
The next issue will arrive in June 2024. Subscribe to it as a newsletter to have it in your inbox then!